The Startup Genome Compass - Behind the Scenes

Today we are announcing the launch of the Startup Genome Compass, a web application designed to aid startups in assessing their performance and benchmark themselves against firms with similar properties.

In addition to the introduction of the Startup Genome Compass, we are releasing a second report that goes deeper into analysis of startups; mainly the implications of prematurely scaling their operations.

The Startup Genome Compass is a result of further research into the properties of startups, and what makes them tick. Several months ago, we published the first Startup Genome Report. The report received tremendous attention, and wide publication. Over 3,200 firms filled out our assessment, and we received excellent feedback and support from the startup ecosystem.

This blog post describes how the Startup Genome Compass was built, and some of the magic behind the curtain. Before I begin, it may be worthwhile to remind the readers about the goal of the project:

The Startup Genome project aims to increase the success rate of startups by deciphering how startups are built, and give entrepreneurs data, tools and recommendations to improve their performance. We try to put quantitative measures on almost all aspects of startup performance in order to improve decision making during the lifetime of firms.

The "heart" of our technology lies in the machine learning process used to identify the startup’s type and stage. The credit for building and fine tuning the machine learning engine goes to Ertan Dogrultan, who became an indispensable member of the Startup Genome team in June. I describe the machine learning process later in the blog post. Before that, here's a short introduction to Machine Learning.

The idea behind machine learning is simple - given a set of examples, called the training sample, an algorithm "can learn" the common patterns in these examples, and try to find these patterns in a new set of data. For example, we can give an algorithm a set of peoples' heights and genders. The algorithm can then learn that men are, on average, taller than women. When the algorithm is given a new set of data on people later, it can predict their average height from their gender.
What machine learning does best is to identify the relevant parameters that can describe a pattern in the data succinctly, learn those patterns and then predict them. In other words, it is good at identifying correlations and interpolating from data.
What machine learning does not do, typically, is explain the process that causes these correlations, or what causes what. I touch a little bit on that later, in the part titled "the usual suspects", but in general, readers of our report should always remember that correlation does not imply causation.

In the next few paragraphs, I will describe the analysis process in the order it was performed, leading to the development of the Startup Genome Compass.

Data Collection
Given the overwhelming response to our report, we were able to collect a significant amount of data. Some researchers have estimated that the Startup Genome now has the largest collection of startup data in the world. The role of our data collection in this phase was less exploratory and more targeted. The major change  from version 1 of the survey was addition of specific questions that could help identify startup type and stage. In addition, we collected more "generic" information (such as age and education information) to be able to compare our findings with previous research about the startup phenomena. Another improvement over the previous survey was making it dynamic - during the survey, the questions changed on the fly according to firms' answers, thus allowing us to ask more questions.

Machine Learning for Classification
In order to analyze a firm, we need to classify it to two types of groups - what type of firm it is, and in which stage it is. It is important to understand the difference between a behavioral stage and an actual stage of a firm.
A behavioral stage is determined according to the firm's actions, e.g., how much money it spends on user acquisition, or how many employees it has hired. An actual stage is determined by a firm's market success factors. Examples are the user growth of the firm, its total number of users and other measures. In total there are several tens of parameters used for each classification.

A classic classification process has two parts - in the first part, called training, an algorithm is given examples of exogenously classified data. This data is used to train the algorithm to be able to analyze non-training data. In the second part, classification is run on the non-classified data, and the results are tested for accuracy.
Our training data was created by our team. We manually classified several hundreds of firms for types, behavioral stage and actual stage. It was a lot of work, but the more firms we classified, the more accurate our algorithm becomes. Pandora works similarly, actually. Every song you hear has been manually classified by a trained “musicologist”, through a process that takes almost 20 minutes.
Once we had a training sample, we needed to tell our algorithm which attributes of the firm to use for training and classification. Every answer to a question in the survey is an attribute of a firm in our data. As many of them are correlated, and also not informative about the type and stage of the firm, we performed feature selection using the gain ratio metric.
We tested several classification algorithms and chose one that was highly accurate and well predicting for our data. Accuracy was determined using cross validation on our trained data.

Identifying inconsistency
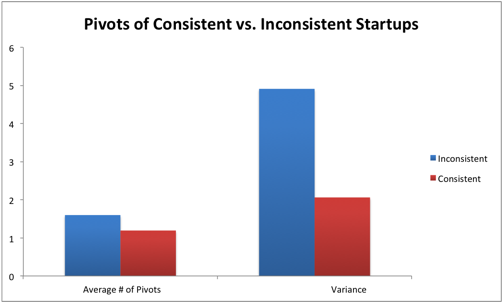
Using our training data, we checked what happens when the actual stage of a firm does not match its behavioral stage. The results (described in the report) show strong evidence that premature scaling is a major cause for startup lackluster performance.
Premature scaling happens when a firm advances in one (or more) of its operational dimensions without syncing it with the rest of its operations. This behavior results in a myriad of issues, such as inability to raise money in later stages, or spending too much on marketing too early, causing customer dissatisfaction.
Our classification algorithm uses the predicted actual and behavioral stages to identify inconsistent firms. The data for these firms is then compared to other firms of the same stage and type.

Transforming math into code
Most of the analysis was done using Weka, with final touches in Excel. Once we had our classification methodology working, our developers transferred the algorithm into a web application that is able to perform both training and classification for the firms filling out the survey.

Visualization
A major investment on our part was to be able to let firms analyze and benchmark themselves against other firms. The amount of information we display to firms includes 23 measures, on top of their Type, Stage and whether they are inconsistent and a personalized research from the Startup Genome Report.
It was therefore very important that our presentation method be both appealing visually, but also informative, allowing a firm to easily separate the wheat from the chaff.
On each measure of the report, we compare each firm to the mean of other firms in its group, and display it location compared to the majority of the group, defined as 1 standard deviation from the mean.

The usual suspects
Some caveats about our process require mentioning:

  1. Applicability to a firm - Reporting average results does not necessarily mean that firms should aspire to change their behavior to match the mean. To put it in other words, you don't tell children who get an A+ in a test to try and get a B in the next time. Our application helps point out where firms deviate significantly from the behavior of the majority. We recommend that entrepreneurs use this is a tool to identify potential issues with their firm.
  2. Classification error - Since we are using statistics to classify firms, our algorithm may have classification errors. This might mean that some firms may be classified into an incorrect type or stage. In our tests, the amount of error is very small, given the large number of variables we are using. The solution to this issue is to identify the causes of these errors, and improve our survey and analysis to handle them. More data is also needed to help with this issue. Therefore, each firm that fills out the survey also contributes to the future enhancement of its own analysis.
  3. Survivability Bias - As mentioned in Jason's excellent blog post, our data is static. We do not have any firms that ceased to exist fill out our survey and tell us why they have failed. Our stages model solves this problem partially, as we are able to put a measure which is better than "dead" or "alive" on firms. We are striving to move from our static analysis of the firm to a more dynamic model of firm performance, which is where our focus will lie in future versions.


What's next for us?
We are very excited about launching the Startup Genome Compass, and we hope it will be useful to the startup community. Our current focus is on collecting more data and improving our surveying mechanism to improve the accuracy of our analysis. The next step is introducing dynamic analysis of startups, which we believe will disrupt the field of startup analysis.

Stay tuned...

Wealth Concentration - Yes. Central Planning? Not so much.

My facebook feed was filled today with links to a post by Tim O'Reilly which itself references this post by John Robb. John theorizes that centralized planning is to be blamed for the recent hurdles the US Economy is facing.

The summary of John's hypothesis is as following:

  1. The USSR failed because of central economic decision making.
  2. Decision making in such a complex system can only be made efficiently by letting the players in the market make small parallel decisions - that is, letting the "market" work.
  3. The US was successful because it was very good at letting markets work. However:
  4. Recently, too much centralized government planning leads to misallocation of resources.
  5. But more importantly, the increasing concentration of U.S. wealth among a handful of rich people leads to even more centralized decision making - only those wealthy enough make the decisions, and they control most of the assets to decide on.
I liked the theory, as it is novel, and gives a new angle to the causes of the recent economic crisis.
I am quite positive, however, that wealth concentration is neither evidence, nor a cause for central planning and its failure in the U.S.
The reason is that wealth concentration hasn't changed tremendously in the last 90 years in the U.S.
And here's why.
As support for his claim about wealth concentration in the U.S., John shows the US Income distribution graph from the NYTimes Economix blog:
If you don't like reading graphs, the one line summary is: "The top rich 0.1% make much much more than all the rest". This indeed shows that income is very unequal in the U.S.
To verify John's hypothesis, we can do three things:
  1. Focus on wealth, and not on income. If the claim is about wealth concentration, why look at income and not total assets owned by people?
  2. See if it changed over time - suppose the U.S. was always unequal about its wealth distribution - in that case, the recent economic issues are probably not a result of that inequality.
  3. Compare it to other countries - If there are other countries, with unequal wealth distribution, and even central planning, do they also face similar problems?
To answer these questions, we need data. Luckily, this page by Sociologist Bill Domhoff from UCSC has all the information required to answer these questions.
So let's start:
  • Is wealth concentrated by a handful of people in the U.S.?
The probable answer is Yes, as can be seen from this NYTimes Economix Graph:
This graph shows that the top 1% of U.S. population controls between 20%-30% of the wealth in the USA.
  • Did wealth concentration change drastically in the last 80+ years?

The probable answer is No.

The following graph, with data as old as 1922, shows that the wealth concentration in the U.S did not change dramatically over the last 25 years or so. To add on that, there is less wealth concentrated in the U.S. by the top 1% today than there was during the 1990s, and roughly the same amount as in the 1960s and 1930s. One caveat is that the data goes only up to 2007, but probably hasn't changed much:
Source: Adapted from Wealth, Income, and Power

This means the U.S. was always unequal in its wealth distribution. 
It's not a recent phenomenon.
  • So how does the U.S. compare to other countries?

The data I found was for the year 2000 (I didn't look too much, though), but let's assume no dramatic changes have happened in wealth concentration since 2000. Also, changes did happen, they probably went in the same direction for most countries. The data is for the top 10% of the population, not the top 1%:

wealth owned
by top 10%
Switzerland 71.3%
United States 69.8%
Denmark 65.0%
France 61.0%
Sweden 58.6%
UK 56.0%
Canada 53.0%
Norway 50.5%
Germany 44.4%
Finland 42.3%
The table clearly shows that although the U.S. has most of its wealth concentrated in the top 10% of the population, this is also the case for Switzerland, Sweden, France, and Denmark. 
All of these countries have very centralized planning. 
Many of them have very high tax rates compared to the U.S.
Some of them are in bad shape.
But Switzerland seems to be doing well, no matter what. Especially given its wealth concentration.
Conclusion: We can't really conclude anything from this short exposition of data, but it looks probable that wealth concentration did not cause more centralized planning which did not cause the recent difficulty the U.S. economy is facing.

צרכנות ומחיה בישראל

לפעמים, כל התשובות נכונות

מירב ארלוזורוב פרסמה היום בדה-מרקר ניתוח של בנק ישראל על שיעור החסכון בישראל, כולל זה של מעמד הביניים.

מסקנות הניתוח פשוטות יחסית - שיעור החסכון מההכנסה נטו של משקי בית בישראל עולה עם השנים, ונמצא ברמה של 12% מהנטו בעשירון השישי. בקצרה - ישראלים גומרים וסוגרים את החודש, ובגדול.

הייתי קצת מופתע מהתוצאות - אם נסתכל על המחאה ברחוב הישראלי, המצב הוא פשוט אינו כזה. עוד הייתי מופתע מהעובדה שמירב פרסמה את הנתונים כמעט ללא ניתוח. ההסתייגות היחידה (העיקרית) היא שהנתונים הם משנת 2009.

ולכן, אני כותב את הפוסט הזה. המטרה היא פשוטה - לא צריך להיות כלכלן (אבל צריך להעמיק בפרטים) כדי להבין איך שיעור החסכון בישראל גדול וגדל, אך משקי הבית עדיין אינם סוגרים את החודש.

לקסם הזה יש שני שמות, וטריק אחד. הטריק טמון בהגדרה של "שכר נטו". והשמות לחסכון הם "פנסיה ופרישה" ו"קרן השתלמות".

נתחיל מהטריק - מהי הכנסה נטו? אם תשאלו אישה או גבר ברחוב, בד"כ יענו לכם - הסכום שנכנס לי לבנק מהעבודה בתחילת כל חודש. הוא כמובן צודק, מכיוון שמהסכום הזה משלמים שכר דירה, חשבונות, עלויות מכולת, חינוך לילדים וכל הוצאה אחרת.

אם תשאלו את בנק ישראל (או הלמ"ס, במקרה הזה), תקבלו את ההגדרות שנמצאות כאן. בקצרה הן אומרות "הכנסה נטו היא הכנסה ברוטו לאחר ניכוי תשלומי חובה".

טוב, זה קצת מסתבך, אבל לא יותר מדי.

"הכנסה ברוטו" - מוגדרת ככל ההכנסות של משק הבית. זהו לא הסכום שאדם מהיישוב היה קורא לו הכנסה ברוטו. זהו סכום שאדם מהיישוב היה קורא לו "הכנסה ברוטו עם כל מיני הפרשות בצד" (או משהו שקרוב אליו מאוד). ההבדל טמון בהפרשות לפנסיה (כ - 5% מהברוטו) ולקרן השתלמות (7.5% מהברוטו). בנוסף, ישנה הפרשה לפיצויי פיטורים במרבית המקרים. לא ברור האם הלמ"ס מכליל אותה בברוטו או לא. בחישובים בהמשך הנחתי שלא. אם הם כן נכללים בחישוב, המצב גרוע יותר.

תשלומי חובה - כאן הלמ"ס ברור מאוד - תשלומי חובה הם רק מס הכנסה, ביטוח לאומי ומס בריאות. הפרשות לפנסיה, ביטוחים, רכב וכו' אינם תשלומי חובה.

לאחר כל בליל הפרטים, הנה דוגמא מספרית. כל החישובים מעוגלים כדי שיהיה נוח לכתוב אותם. החישובים נעשו באמצעות אשף הנטו של חילן טק. בחישובים הנחתי ששכיר בעשירון השישי זכאי להפרשות מעביד לקרן השתלמות. אם לא, החישובים משתנים.

לפי הכתבה בדה-מרקר, השכר נטו של אדם בעשירון השישי הוא 10,982 ש"ח בחודש.

מהו השכר ברוטו של אותו אדם?

החישוב קצת מורכב (בגלל כל ההפרשות בצד), אבל לפי הלמ"ס השכר יהיה כ - 13,000 ש"ח לחודש. לפי האדם מהיישוב, ואיך שמוגדר תלוש המשכורת שלו, השכר הוא 11,500 ש"ח.

להיכן נעלמו 1,500 ש"ח? כ - 900 ש"ח מפריש המעסיק לקרן השתלמות, וכ - 600 ש"ח לפנסיה.

ההבדל לא מסתיים כאן. אמנם הלמ"ס אומר שההכנסה נטו הינה 10,982 ש"ח, אך בפועל, תלוש המשכורת יסתכם רק בכ - 8,700 ש"ח לחודש. כבר סיכמנו ש - 1500 ש"ח מההכנסה נטו מושמת לחסכון על-ידי המעסיק. איפה שאר 800 השקלים? הם מנוכים מהעובד מתלוש המשכורת, לאותה פנסיה וקרן השתלמות.

אם נסכם את הכל, החישוב שלנו הראה שכ - 2300 ש"ח מופרשים כל חודש כבר בתלוש השכר לחסכון. מדובר ב - 20% מהכנסה נטו על-פי הלמ"ס.

אלא מה? הפלא ופלא! לפי הכתבה, העשירון השישי חוסך רק 12% מהכנסתו נטו. וכרגע אמרנו שהחסכון הוא כ - 20%!

וכאן טמונה העצם - העשירון השישי אכן חוסך סכומים מכובדים מאוד, רק שאת חלקם הוא יראה בזמן הפרישה (גילאי 60-67), ואת חלקם פעם בשש שנים, בהיותם שייכים לקרן השתלמות. אף אחד מהסכומים האלו אינו נכנס לחשבון הבנק בתחילת החודש ומאפשר לסגור את החודש. ההפרש הזה, של 8% מהשכר נטו (כ - 800 ש"ח) נמצא באוברדרפט של שכירים בישראל, ותופח עם השנים בגלל הריבית.

מסקנה - כולם צודקים - מעמד הביניים חוסך המון בעתיד, אבל נמצא במינוס תמידי בהווה...אין זה בהכרח אומר שצריכים לבטל את ההפרשות לחסכון בתלוש המשכורת, אבל זה כן אומר שכשבודקים את יוקר המחיה של משקי בית, צריכים להתעמק בפרטים של הנתונים.

Deciphering the genome of ... startups!

Over the last three months or so I had the pleasure of working with the talented team of blackbox.vc (http://blackbox.vc/) on the startup genome project (SG).

The goal of the project is extremely ambitious - to map, model and analyze what makes startups tick, what helps them succeed and why many of them fail. We are hoping that the insights generated through this project will create useful tools for increasing success rates of startups during their initial growth periods, as well as will shed light on interesting phenomena, pitfalls to avoid and much more.

My part in this project was to aid with the technical and scientific analysis of the data, anywhere from initial definitions of the questions to be answered up to giving input on what conclusions can be drawn using different statistical techniques. An academic marketing background is excellent for this purpose, as it brings in tools from survey design, econometrics, some psychology and more.

[Source: 12manage.com]

The process was fun (and is still going on), but initial results will appear any day now first report we publish. One interesting conclusion is that many firms today, especially young startups, own hordes of data they are not sure how to handle. This is similar to a person striking an oil field, but without any refining technology in sight to turn oil into usable fuel. The firms sit on gold (or oil) in the form of data, but cannot tap into this resource because of uncertainty on how to attack such a problem.

I think there is a lot to be learned from how we analyzed the data and the methodological process that happened while writing our report, and this post is aimed at telling the story. If there is any specific part or topic which you are interested in, leave a comment in the comments section, or contact me, and I'll do my best to elaborate more. If you're interested in future updates, just follow me on Twitter.

As in any genome project (as if I was ever part of one), there are three main parts to this project:

  1. Mapping - Initially, we were first tasked with a simple question - we had lots of data, some of it good, some bad, some accurate, some not - what is there that is useful?
  2. Modeling and Hypothesizing - Once we had a better grasp of the data we had in our hands, we needed a way to think about the questions we would like to answer. In order to ask smart questions, we needed a simple way to describe the process startups go through, if they go through a standard one at all.
  3. Analysis and Reporting - Given a model and the data, we set upon checking our hypotheses and drawing conclusions from the validated ones. We ended up with tons of numbers, tables, graphs, equations and what not. The final goal was to somehow synthesize it all into readable content, which is also (hopefully) actionable.


Mapping and exploring Data


The initial survey created by Max and Bjoern and the rest of the StartupGenome team was exploratory in nature. It contained a long list of questions covering many areas that can describe a startup to an outside observer.
In more formal language, the survey took a static view of the world and tried to capture a snapshot of a startup's developmental stage using a list of questions. The team had understood that a static view will probably provide very limited actionable information for startups, since the current stage of a startup does not contain all of its historical information. We had, however, to start somewhere.

The goal of the survey was to give us enough information to formulate a model that we can later focus on and test in future surveys. The future surveys are planned to take a more dynamic view of startup development. Although the SG team had an initial model in mind, it was still unclear if the model is correct, and what the answers to the questions would look like.

The first thing we had to do, given survey answers, was to describe them in a succinct and parsimonious manner. (On a side note, did you ever notice how people like to use "parsimonious" to say "simple" in a non-simple manner?).

The result of describing the data is called "descriptive statistics". The typical descriptive statistics are averages, standard deviations and counts of various aspects of the data. In our process we created a huge amount of different cuts, views, cross tabulations, graphs, means and statistical significance tests to check relationships and correlations in our data. Once we had those, we leaned back, looked at them from afar and tried to ask ourselves "do these results make sense".
The sanity check stage was very important, it showed us where we had inaccuracies and other problems in the data, where the people who answered the survey may have misunderstood the questions, and also where initial correlations show a promising direction for deeper research.

An interesting question was what tool to use to perform data analysis. As uncool as it may be, I still believe Microsoft Excel (yes, even the Mac version) is by far the most powerful tool to work with with raw data if the amount is not too large (up to 1 million rows of data or so).
It lets you easily filter, change, transform, graph, cross tabulate and do many other tasks very simply.
Another option would have probably been using SPSS for that manner.
Google spreadsheets is getting there, but until a week ago had no pivot table support, which was our main tool for generating insights and reports.

Some interesting things we noticed in this process were:

  • There was a lot of useful information that could be gleaned even from the simple descriptive statistics. When we showed it to outsiders, the typical response was "wow, that is something I wish I had known before".
  • Some of the survey questions could have been answered in several different ways for the same answer. The main reason was the different startups viewed their market potential, and potential customers in a subjective manner which can be interpreted in different ways. This gave rise to the concept of a startup "Type" which says that startups belong to underlying families. Startups within a family seem similar, but they behave very differently across families. This is one of the main themes in our initial report.
  • It is very hard to tell from a static snapshot of a startup whether it is successful or not. That is, even given all of the details about the founders, their current stage, whether they raised funding and whether their product looks like it has a good fit with the market, it is still hard to differentiate a winning from a struggling startup without knowing more of how it evolves over time. One conclusion is that the current investment process in startups is done "half blindly" because of the tendency to do a static analysis.

Modeling


Once we had our descriptive statistics, we wanted to start and see if we can tell which startups face more difficulties than others, and whether we can create measures that startups can use to benchmark themselves against best practices.
I remember that in our first day of working on the data, Max had a pretty solid understanding of the stages model and what is the current common knowledge in industry about what stages startups go through, and how. I served as a sort of "devil's advocate" and "question guy", constantly asking questions about the model, and whether answers from the surveys could be interpreted as a one-to-one matching to the different stages in the model. Another thing that had to be done was transform the abstract stages model into something mathematical, or something measurable. Markov chains came as a natural model, and more on them is described later.

We then looked for questions in the data that will identify a stage. Identification (in the academic sense) has a very specific meaning, but intuitively, it says that a specific piece of observed answer or data can only mean a specific value of some unobserved information.
To put things more concretely, in our case the observed data are the answers to questions to the survey, and the unobserved information is the stage a company is in.
Here's an illustrative example (but it's not exactly what we did):
When firms were supposedly in stage 3 or above in the SG model (known as the Efficiency stage), they were supposed to have already achieved a fit between their product and their market, and were also supposed to scale their sales and marketing by pouring money into it.
As a result, we used to questions analyzing the product/market fit and marketing expenditures to determine whether a startup was in stage 3.
We performed this process for every stage in the model, and for each startup we had a Yes/No answer to whether they passed through each of the stage.

We also calculated a "score" for each firm, depending on its recorded answers and clustered firms according to similar score areas, and hence received the aforementioned startup "Personality Types".

Suddenly, we had a serendipitous moment.

We noticed some startups didn't go through all of the stages (according to their answers). We called these startups "inconsistent" and went to their detailed answers to see what inconsistency means. We found out that inconsistent startups were much more likely to lag behind and face difficulties in their developments. Inconsistency looked like a good predictor (or correlator) with a struggling startup.

[Source: StartupGenome Report]

This was an initial indication that the stages model makes sense as a view of the world.
The second thing we did regarding our modeling is assuming our stages model is correct. As a result, we received a model where a (consistent) firm can only move from one stage to the other sequentially. The entire model can then be seen as a Markovian process, or specifically, a POMDP.

If I were to explain what a POMDP is in one paragraph, think of a person making decisions which you observe, but you do not observe the underlying information the person has. Since the person uses the unobserved information to make decisions, one cannot analyze the chain of decisions at face value, but rather needs to have a "belief" about what the decision maker knows and does not know. If we then assume that startups of the same personality type are similar (homogeneous), we can assume the date we observe in the world is an equilibrium of sorts of a process for generating startups and having them move through stages.

All this babble mean we can treat the data for different startups in the same type as if it was almost the same startup in different stages, and reach some nice conclusions.

To simplify things, however, we just assumed we "know" the underlying stage (given the answers to survey questions), and tried to see what actions carried on by entrepreneurs help them move through actions.
Actions, as an example, can be hiring employees, pivoting more, raising money, consulting mentors and more. They do not indicate the stage of a startup (in our model), but can help a startup advance in its stage.

The technical method we used to estimate this model is a "simple" ordered probit, where firms generate "value" which is then converted to a stage by an outside observer. The software (for the geeky oriented) was Stata.
Our initial results seem promising and will be published once we formulate their presentation style (they are complex to read) and also finish all of the statistical testing.

Analysis


In many of my previous encounters with big data analysis projects, both in my VC years as well as in other positions, I noticed that most people stop after step 1, some continue to step 2, and almost no one does the important job - that of step 3.
Step 1 and 2 are descriptive steps - they tell us how the world behaves and what it looks like. It is interesting, and as people, we love reading graphs, seeing statistics and digesting information.
The reason (and this is purely a conjecture of mine) is that as people, we do not like uncertainty, and statistics brings some order to how we grasp the world.

The main question, I think, is what you do with the statistics and the data. The goal is to provide actionable results for startups, and although we have initial results, we still have a lot of work to do.
The analysis step is (in my opinion) where the true creativity of the team will come out. What we do is first take a step back, and look at the results. We analyze if they make sense and what they mean.
Then we ask a simple question: "What would happen if we actively changed something, or did some action". To test this, we can run a survey, perform an experiment, or run a simulation assuming our model is correct.

I guess our next step with the project is to focus more and more on the modeling and analysis phases, until we will reach the exciting conclusions we aim for.

If you've reached this far down the post, I hope you enjoyed it. As a summary, just remember that every data analysis task, as daunting as it may look has only 3 typical steps, and that the best results, in my opinion, are achieved only when you get past the Analysis phase.

A note on statistics: Many of the results presented in the report are based on somewhat small samples, mostly for the personality types. The majority are statistically significant using simple tests. We have tried to specify all the interesting cases where conclusions might not be statistically significant. During our work we have refined many questions in the surveys and are now collecting more data to validate the results and make inference more accurate.

More is yet to come. To keep tabs on future results, just sign-up for an email update from this blog, or follow me on Twitter.

How the industry of innovation makes itself obsolete

There's a lot of buzz lately around Silicon Valley about angel investors, startup accelerators, crowdfunding, business model development and much more.

A typical claim is that the VC business model is broken. Another one is that VCs have just not adjusted to the modern needs of their companies.

As I am not in the valley, I watch the changes somewhat from afar, but not too far. This gives (IMO) an excellent perspective on things, and one of the interesting phenomenon is how the VC industry is funding its own demise.

If you're reading this blog and know nothing about VCs (venture capitalists), here's a short explanation: VCs take money from investors, and invest it in startups. Their (claimed) expertise is allocating investments smartly in a way that funds groundbreaking innovations that bring huge returns to their investors.

The industry started in the early 1960s (late 50s even), and had funded probably every large and innovative technology company you have heard of or not, including DEC, Apple, Cisco, Google and many more.

In the last 5 years or so, a big shift in the industry can be observed - much smaller investments are needed to start a company, and VCs many time stay outside the game of the smaller company creation and exit process.


The typical explanation is that starting a company requires smaller amounts of capital, and as such, VCs are just too big to succeed.

If you think about it, however, VCs are exactly the reason costs are so low to begin with.

Over the years, the technology industry invested significant amounts of money in making technology more affordable, available and easy to use.
One result, for example, is the emergence of e-commerce. In case you did not notice, the following chains went into bankruptcy (or closed their stores) in the last 5 years: CompUSA, CircuitCity, Borders, Tower Records and Blockbuster.

What's common to all of them? They needed to compete with an ever growing online selection and new business models relying on lower costs driven by technology.

And the same thing is happening to the VC industry. If at first VCs have funded innovation in areas such as semiconductors, telecomm, banking and travel (have you used a travel agent lately?), where manual labor was slowly replaced by computerized technology, later they funded inventions that lowered the cost of creating technology in general.

One result was that they created a lot of rich people, who are technology savvy, and can easily compete with VCs when the costs are lower. The second result is that the wave of "basic/big" infrastructure innovation is mostly over, and as the technology sector matures, their services are less needed.

The third result, which is probably the most interesting one, is that VC investment is essentially a manual process. It is grudgingly slow, and sometimes inefficient.

So what does the technology industry do when an inefficient manual process exists? It creates the technology to replace it, or make it better and more efficient. As a result, service such as the Angel List had sprung up, as well as technology accelerators and several other projects and tools.

This is literally slowly cutting off the branch you were sitting on, while inventing the saw, and making money of selling saws.

How will the VC industry react?

Although a famous (Hebrew) saying is that Prophecy is given to fools, I will go out on a limb and say that many VCs will disappear, and the rest will fund truly great innovation, or shift to different industries.

Self inflicted paranoia - The "secret" of insurance deductibles

It is a well known fact (or at least strong belief) that most people make very wrong choices with respect to buying insurance products. The majority of people over-insure, that is, pay much more than they should, or just neglect to purchase insurance altogether.

This post turned out to be a bit long and somewhat technical, but here's my promise - if you can keep with it until the end, the chances are you will feel fooled by insurance companies, but will also be able to save lots of money in the future.

As someone who studies consumer decisions, buying insurance is one of the most fascinating phenomena to study, for several reasons:

  1. Insurance is a complex product, containing many details, but at the end, there is just one price (premium) to pay.
  2. Consumers buying insurance need to make many decisions about many "parameters" of the product they buy.
  3. Insurance sells something in the future (coverage against negative events), that might happen or might not - who can predict his own future with accuracy?
  4. The product sold is very emotional - it is related to negative events with big and bad impact. Most people have a hard time entangling their emotion about the event itself and the decision of how much coverage to buy.
  5. The insurance industry (in the US) is rather competitive, so the products are abundant, advanced and should be fairly priced.
  6. People make the decision to buy insurance over and over again, many times annually for a period of 30-40 years. This means there is ample time and information for learning from past mistakes.
I am fascinated by this phenomenon, since it shows how firms produce a complex, emotional product and profit on consumers' inability to understand too many details, or their plain fear from negative events.
A very interesting and roughly "simple" parameter of insurance where consumers make almost unanimous mistakes is how much deductible they would like to pay in case of an insurance event.
A paper by Justin Sydnor analyzes the case of homeowners insurance, where this paradox is sometimes stronger than in the case of other insurances.
To have a clear example, let's take auto insurance deductibles for instance.
A deductible is a sum of money that someone pays from his/her own pocket before the insurance kicks in. For example, if a car was involved in an accident with damage worth $2000, and the insurance policy has a $500 deductible, the insured will pay $500 from his/her own pocket, and the insurance company will pay the remaining $1500 to fix the damages.
If the damage was less than $500, the insured person pays for all the damages from his/her pocket.
Why are deductibles interesting? Deductibles are interesting because they come with a clear menu of options. 
A typical auto insurance offer will have the option (for example) to select deductibles of $250, $500 and $1000. In addition, a change in the choice of deductible affects the price of auto insurance greatly.
Every time a person chooses a lower deductible, they need to pay a higher premium for that. That is, the price of having to pay less out of pocket in the future, costs more today.
The second interesting point about deductibles is that the difference between one option to the other is very clear - the value of a $500 deductible vs. a $1000 deductible is at most $500 per year.
If you don't see why, think about it for a minute - buying a lower deductible just gives you the option to pay less of the difference in that year.
Let's focus on the choice of a $500 vs. a $1000 deductible. Here comes the interesting part (if I haven't lost you by now) - how much are people willing to pay for the option to pay less in the event of an accident?
That depends only on one parameter - their beliefs about their probability of being involved in an accident with damages over $1000.
(To simplify things. This is very close to the actual reality).
It is important to understand this does not depend of how much damages will be created to the car (once they are above $1000), since everything above $1000 is covered anyway by the insurance company.
If you go to your car insurance provider, and ask them for two quotes for the same insurance policy, with just one difference, one quote for a $1000 deductible, and one for a $500 deductible, the difference in annual (yearly) premium will probably be on the order of $150-$250. Let's suppose it's $150.
I urge you to go and check. This difference can be very different for many people.
What does this mean? It means that if you believe you will have a 150/500 chance of an accident (30%) with damages above $1000, you should buy the lower deductible. 
Why? Because you are paying $150 extra every year for the chance of getting $500 in return (or the chance of not paying $500 in the event of an accident). If this chance is higher than 30% (say 40%), you will get back 500*40% = $200 back, thus having a "profit" of $200-$150=$50. If this chance is lower than 30%, you will get back less than what you paid, on average.
Is 30% chance a lot or a little for having an accident? Think about it - if you are involved in a car accident with big damages roughly every 3 years, 30% is about right (100/30). If you are not (and I hope most people are not), then you shouldn't get the lower deductible. To make things worse, if the difference of the two quotes was $250, and you bought the lower deductible option, it implicitly means you believe you will be involved in such an accident every second year (250/500 = 50% chances of an accident each year). Assuming you and most people around you are decent drivers, this is clearly a self inflicted paranoia.
Another way to look at it is as a savings scheme - get the higher deductible, and put the savings from insurance price in a savings account, and call it "emergency car repair fund". Use these funds only to pay for deductibles. I would assume this "fund" will pass the value of $500 quite fast.
There are essentially only two cases where buying a lower deductible is worth it:
1. You cannot afford the $500 in one time - In case of an accident, if you cannot afford to spend $1000 (but can afford to spend $500), then get the lower deductible. In this case you are basically paying the insurance company a very high interest rate (roughly 15%-20% is my estimate) on having not to save $500 on the side.
2. You are a very reckless driver - If you are prone to accidents, get the lower deductible. Insurance companies are smart as well, though. The chance your entire premium won't raise once you have a bad driving history is zero, so you will be paying for being reckless anyway.
This anomaly can happen in any industry where insurance is sold, but I have a hunch it happens the most where the  negative events might have large financial consequences - health insurance, home insurance, earthquake insurance and such, and also when recent negative events have happened. If you've paid attention, however, you should be able to say by now that the choice of deductible should depend on the size of the "average" damage and not the "extreme" damage, since both deductible options will cover the extreme damages.
Hopefully after reading this, some of you went to check out what their deductibles are, and some of these some, saved roughly $500-$1000 per year on unnecessary over-insurance.

Are VCs the new recruitment agencies?

Roughly a month ago I had a lovely brunch with two friends, both currently in the online advertising industry.
Our chat touched on many topics, from crazy Halloween parties to China's media agency.

If you ask yourself "Huh?", the answer is Yes - they are connected in some twisted way.

We finally resolved to talking about the recent burst of small startups, small investments and multiple small exits of companies occurring all around the bay area. Are these signs of a new "tech bubble"?
Some attributes of the current frenzy are similar to previous tech-crazes, but one is unique - the exits are not IPOs but rather many small acquisitions by larger firms, and the investors are not "regular" people doing it through the stock market - they are "sophisticated" angels and acquiring firms.

At one point, I raised my hypothesis that it appears that investors are recently being "exploited " as recruitment agencies by entrepreneurs and acquiring firms.

And it goes like this.

Once upon a time, perhaps 5-10 years ago (or more), founding a startup required significant initial capital. Getting the business to grow and to become profitable, or even with decent traction required on the order of $10M-$20M if not more, except for certain stellar cases.

This caused two phenomena - entrepreneurs had to either raise considerable amounts of money to start a company, or join a large company with a strong financial backing to create their dream products. It was not possible to just "create it and see if it works".


As a result, investors required significant return to let a company be founded, let it grow and then let it be sold. Let's say 5x return would have been considered good. When an acquirer would come, and see that startups spent $10M-$20M, they would know they would be required to shell around $100M to buy the startup to make investors happy.

If you're saying to yourself - "this is not how companies are valued", be aware that sunk cost fallacies are big players in the investor's world, VCs and angels included.

Shelling $100M and upwards is a big deal. Not many companies can do it, and the ones that can really need to justify it to their shareholders, their board, and essentially themselves.

In the last few years, however, it is much easier and cheaper to to start a company. In the Internet business, a founder or two with little or no money can launch a web product. Some very creative ideas have sprung up with an investment of just time, or less than $100k.

This situation is a game changer for two reasons:
1. Talented entrepreneurs (see my post on Talent vs. Business acquisition for the definition of what I call "talented") suddenly have the opportunity to create their dream product without owing almost anything to anyone. Since their passion is many times about the product, and less about building businesses, once the product exists and is a success, it makes sense to be absorbed in a large firm to grow the business.

2. Large firms suddenly found themselves without talented employees. If in the olden days the promise of a big budget and great technology was enough to lure the talented entrepreneurs, today this budget is not necessary, and the technology is easy to create and build. How can you then bring in talented people?

Give them a big "sign-in bonus"! As firms now do not need to compensate investors with large sums for building a product and a business, these sums are transferred as "bonuses" to the startup founders and hopefully a small set of employees.

So why are investors serving as a recruitment agency? The answer is simple - finding which entrepreneur is talented requires to let them (the entrepreneurs) try. Someone needs to cover the cost of this "test", and angels (microfunds, super-angels, anyone) seem to have taken this job upon them.

Dilbert.com

Their money is used not to build businesses, but to vet future employees. Essentially the smaller investors do not create competition for larger firms, but just strengthen their market position by helping entrepreneurs be acquired early.

They are compensated generously for their investment, but not much value is created through the process - just a lot of trial, error and acquire.