
Imagine that you ran an A/B test using two variations of a webpage and measured their conversion rate. At the end of the experiment, version A has a higher conversion rate than B, but the difference is not statistically significant. What do you do?
I often ask students and executives this question, and receive one of two responses:
- Continue to run the test until it shows statistical significance (Oh dear...don’t do that, unless you really know what you’re doing).
- Pick version A even if the result is not significant.
The immediate follow-up question is: “If you pick the best performing version anyway if the results are not significant, why test for significance at all?”
The TL;DR answer is that you shouldn’t test for significance if you want to maximize your profits using A/B tests. You should design your experiment (and sample size) to detect large effects, and not worry too much about making mistakes when A is not too different from B. In this blog post I’ll explain the main ideas Elea McDonnell Feit and I developed in our recent paper Test & Roll: Profit-Maximizing A/B Tests. We used these insights to derive a new experimental design and sample size formula for A/B tests which yields much higher profits (and much shorter experiments) than using traditional hypothesis tests.
What is the goal of an A/B test?
When people run an A/B test, they usually have a goal in mind. That goal might read something like “Run a test comparing A and B. Then pick the version that performs the best”.
Hypothesis tests, in contrast, were designed by statisticians to answer the question “Can we confidently say that version A is different than version B?”. That means that hypothesis tests focus on not making the mistake of claiming that A is different than B when they are not (what is known as a Type I error).
But for profit maximizing A/B testers, this mistake has no consequence -- suppose you believe that A is better than B (as the test result shows), but in reality this is all noise and A performs the same as B. By choosing to move forward with version A, you lose nothing. The hypothesis test focused you too much on detecting very small effects.
This focus usually results in extremely large recommended sample sizes. Often much larger than the population available for a test. But in tactical A/B tests (which we call a “Test & Roll”), a firm often wants to run a quick test on a small population (Test stage), and then deploy one variation on the remaining population which was left out of the test (Roll stage). If the population is not extremely large, or if the effects are small on average (both of which are common cases), using hypothesis tests is too conservative and lowers the profit of the firm, because too much effort is wasted in the test stage.
How to run a Test & Roll?
In its simplest version, a Test & Roll has two stages. In the test stage the data scientist runs an A/B test on some small population of size n out of N potential customers. Once the experiment is completed, the data scientist deploys the version with the highest conversion rate on the remaining (N-n) customers. Pretty simple, eh? There are no hypothesis tests involved.
How large should the test population n be?
In the paper we develop a new sample size formula:
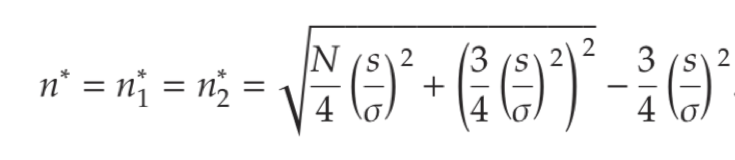
In this formula, N is the total size of the available population (for the Test and the Roll together). ???? measures the variation in performance across different treatments, which a data scientist can estimate from results from previous experiments. s is the expected standard deviation of the data within the experiment, which again can be estimated from past experiments. In the paper we give three examples of how to find ???? and s, for offline catalog holdout tests, website A/B tests and online advertising tests.
To make using the Test & Roll formula easy, and to allow you to compare the expected benefit of Test & Roll (before deploying it), we created a nifty calculator at http://testandroll.com.
How well does Test & Roll perform?
This table, adapted from the paper, shows how well Test & Roll performs compared to hypothesis testing, to the optimal possible allocation (assuming the data scientist actually knows which treatment is better without the test), and Thompson sampling, which is a variant of a solution to the multi-armed bandit problem. The comparison is done on data from a few thousand website A/B tests:
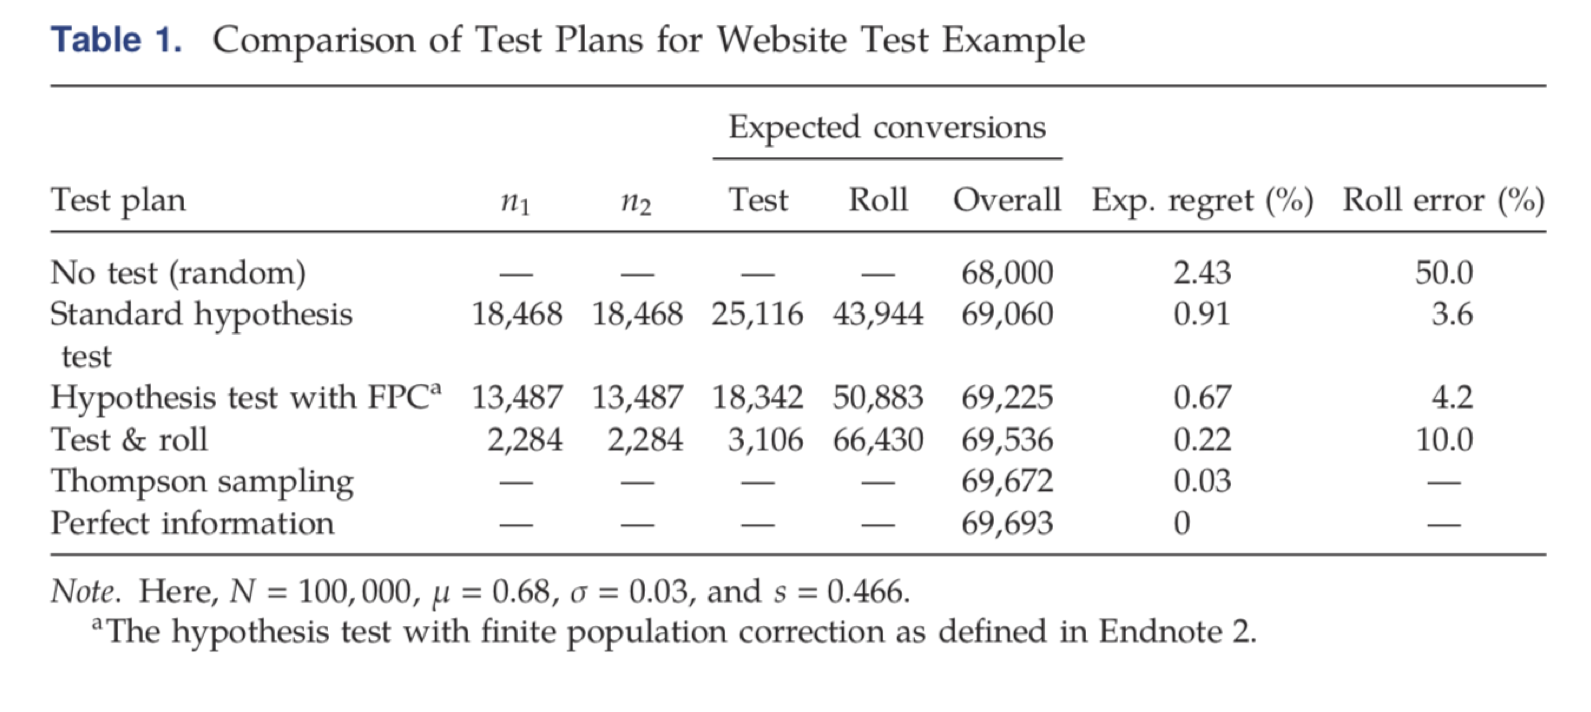
To compare algorithms, we usually use a measure called “Regret”, which (roughly) answers the question: “How well does this algorithm perform compared to the theoretical optimum, where we know all the information in hindsight”. The table shows that Test & Roll has about one quarter of the regret of a standard hypothesis test, and not much higher regret than the more sophisticated (and complex) multi-armed bandit.
This result repeated itself in all of our applications, and even when we tried to “break” Test & Roll and find cases where it performs much worse than a multi-armed bandit, it was pretty hard to do. If you’re not familiar with multi-armed bandits, it is basically a fully dynamic approach (not only two stages, but many stages) to maximizing profit while learning from the data of previous customers.
Why does Test & Roll work?
The intuition behind Test & Roll is pretty neat. What Test & Roll does is create a trade-off between the test and the roll stages. If a lot of users are allocated to the test stage, the algorithm will pick the best performing variation with very high confidence, but then in the roll stage, there wouldn’t be enough customers left to exploit the fact that we know which variation is the best.
If not many users are used for testing in the test stage, we get the opposite - the algorithm will often make mistakes, recommending to pick the lesser performing variation.
But this is the crux of the magic - when the treatment effect (the difference between A and B) is large, the algorithm will pick the best variation with high confidence even with a small sample of users in the test stage. In other words, even very small tests are good at finding large effects, and the benefit from them is very large.
And what about the mistakes from smaller treatment effects? In that case the damage for profit is negligible. Focusing on large effects allows the data scientist to quickly find these “much better” variations, and move on to the roll stage.
This behavior can be observed in Table 1 above. Although Test & Roll picks the worst performing variation in 10% of the cases (compared to only 3.6% mistakes for standard hypothesis testing), it does so primarily when the differences are small, and in the end, these mistakes don’t matter much.
What else can Test & Roll do?
Test & Roll can be adapted to cases in which the data scientist has some prior information that one variation is probably better than another, or to cases where these is a “default” variation, and only if the new one performs much better the switch is made.
Plugging this information into the complete Test & Roll formula (which appears in the paper) yields asymmetric tests, where one variation gets allocated more users in the test stage than the other, to gain even more improvement in the profit.
Test & Roll can also be adapted to cases where the data is not normally distributed (or can’t be made normal through a transformation). For example, if the experiment tests 0/1 conversions, and the data is not very large, a numerical approach can be used to design Test & Roll experiments for binary data.
Summary
Test & Roll is designed for quick, tactical A/B tests (which many companies run all the time). Using the sample size formula we derived, we expect companies to achieve higher profit than using hypothesis tests to design their experiments, and we expect them to achieve these profits faster. Test & Roll will often recommend a dramatically smaller sample size for your experiments, and will make decision making clear and transparent.
I’d like to emphasize that Test & Roll is not a panacea for all your experimental needs. When the cost of a mistake is substantial even for small mistakes (for example, in clinical trials where life might be lost), hypothesis tests are the way to go. In other cases, where the question is to really determine behavior (“is A really different than B?”), hypothesis tests are again warranted. The idea behind Test & Roll, and other new approaches to experimentation, is to match the technique used to the decision that is being made.
Recently, Chris Said wrote an excellent series of blog posts where he developed an approach similar to ours (using the same principles) where instead of using a finite test & deploy population, the data scientist has a trade-off between the profit they want to achieve, and the amount of time it will take them to run the test. Quite neatly, Chris arrives at a very similar sample size formula to ours. I think it is very cool that two seemingly different approaches reach a very similar conclusion.
Finally, I tried to avoid going into much of the mathy details behind Test & Roll, but I highly recommend reading the paper if you’re interested in them. It is pretty short, and we made a big effort to be as clear and transparent as possible about the benefits and limitations of Test & Roll.
In case you have questions, comments, feedback etc., please do not hesitate to leave a comment, or contact me and Elea. Even better, if you would like to collaborate with us on developing the next phase of A/B testing techniques, we would love to hear from you!